|
||||
 |
LaborPro Design About Us |
|||
The LaborPro is a Microsoft® hosted Excel™ spreadsheet that will assist anyone interested in tracking worker attendance and hours worked during their calendar year. Future year tracking is possible through a few user changes to this program. The spreadsheet allows up to 50 workers to be tracked by user input items (like hours worked) per week and has user input absences. Why
Track People? Two Management Reasons 2. By seeing the pattern of the number and types of absences (by day over a period of 1 year) on each Worker/Technician Page (T1, T2 etc.), coupled with when these absences took place (Monday, Friday and before/after holidays), would give you an indication of how dedicated an employee was to your project(s). A good (project) manager or coach promotes hard work and rewards dedication. We sometimes overlook our favorite peoples' indiscretions, even though it affects the project profit. However, a team cannot function at peak performance if some people do not pull their goal weight.Make the Tracking Personal As an example, on a weekly basis you can track the following: 1. Hours worked on a project 2. Hours worked 3. Homes Closed 4. Customer Contacts 5. Golf Scores 6. Lines of Code Written 7. Pints of Blood at a Hospital
As
on overview, LaborPro is broken down into 4 areas: |
||||
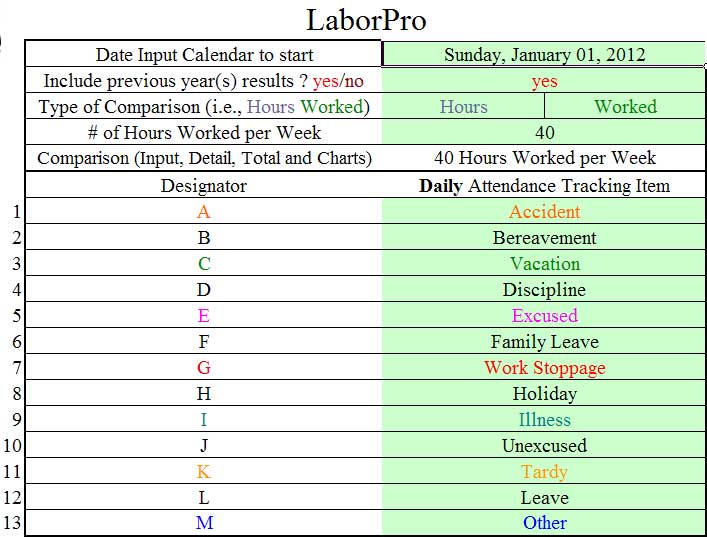
Area 1: Parameter Sheet feeds every sheet The
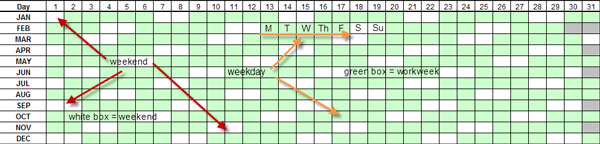
date calendar starts is 1/1/2012 Each T sheet will depict 2012 days (green - Monday through Friday and white - Saturday/Sunday)
|
||||
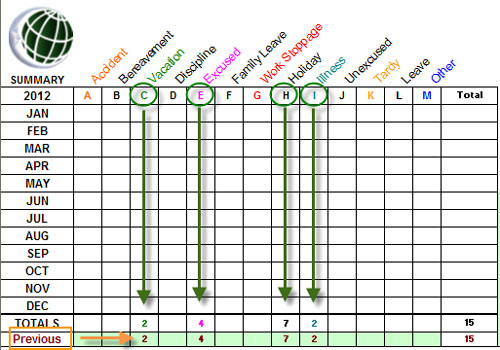
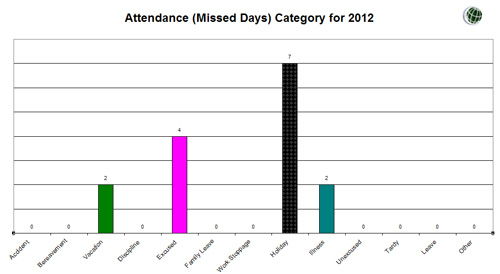
| Example
for year 2011, "Technician 1" had 15 absences -4 excused absense -2 vacation days -2 illness -7 holiday no previous year absences were recorded. |
||||
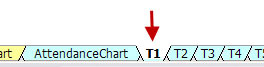
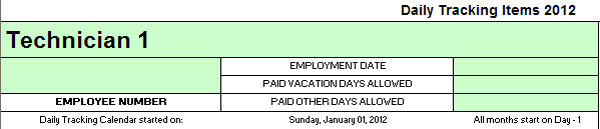
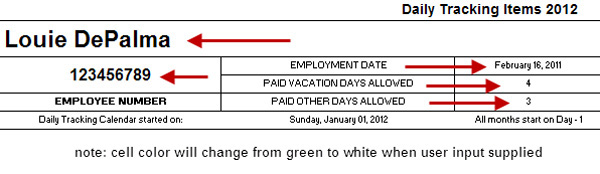
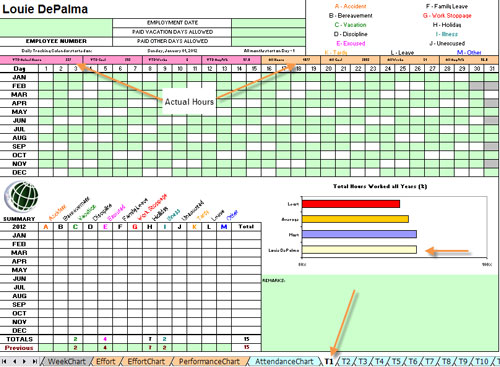
Access the T1 data at the foot of the AttendancePro Sheet
Enter specific
employee information
|
||||
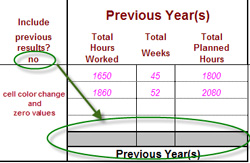
Under
the Summary Area enter previous year (s) information |
||||
|
||||
|
||||
 |
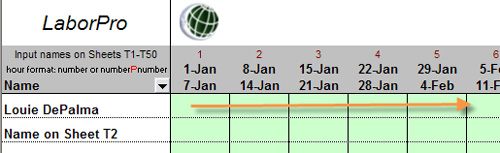
||||
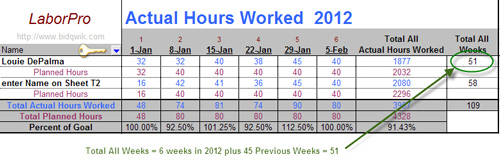
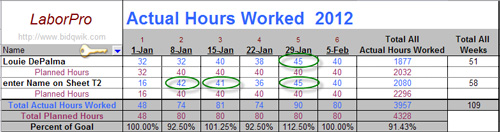
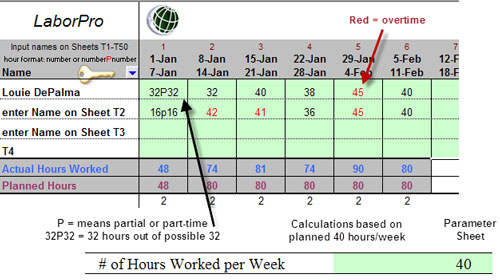
The Input Sheet tracks weekly work activity (based on 40 hours set on the Parameter Sheet). One excused absence day (8 hours) for a week would be 32P32 (P-means partial). An 8-hour unexcused absence would be a plain 32. A part-time employee who works only 16 hours per week would be input as 16P16 to represent that person was present for all required dates and did not miss work. Overtime of 5 hours could be represented by 45 or 45P40 or 35P30, depending on work loads. |
||||
 |
||||
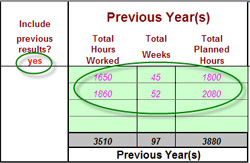
Louie DePalma had a previous year input of 1650 hours worked out of a possible 1800 hours in 45 weeks "enter
Name on Sheet T3" had previous year input of 1860 hours Total
|
||||
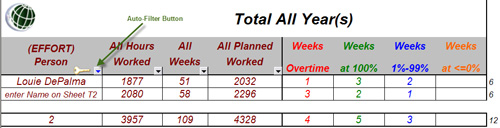
| The Detail Sheet will list all technicians/workers and tally their hours worked by category | ||||
The Detail Sheet will include the previous years values. Louie is now at 1877 hours out of 2032 hours thru 51 work weeks and "enter Name on Sheet T2" is at 2080 hours out of 2296 labor hours thru 58 weeks.
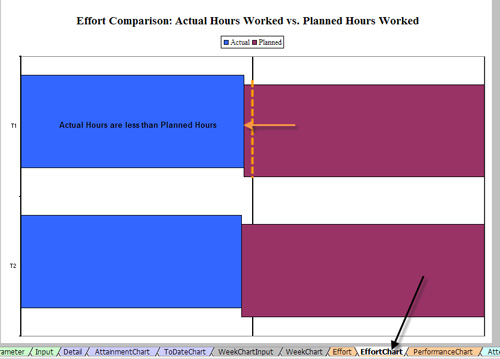
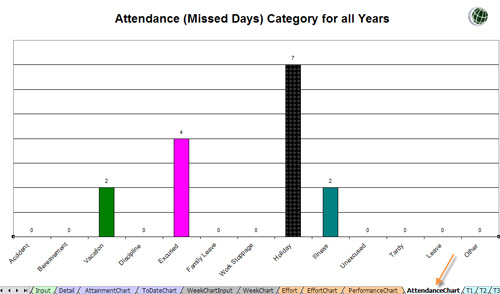
The Effort Chart will depict only the current year values.
|
||||
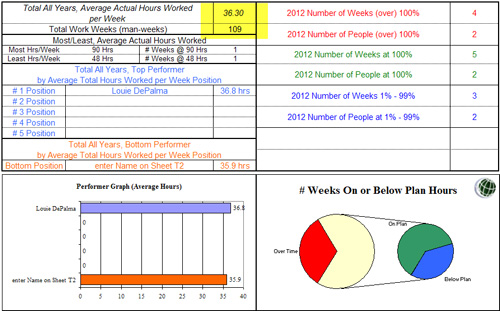
The Average Total Hours for this years and all previous years are tabulated. This will be extremely helpful to ascertain if we were increasing the business base and if the workers were keeping up with their hourly obligation to profit. Through this example:
over all years, we see that our technicians worked an average 36.26
hour work week based on 109 weeks of work. This year, the
Overtime work hours are based on 4 weeks by 2 people. The pie chart
lists the total hours split by overtime and all other time. The pie
breakout lists the:
|
||||
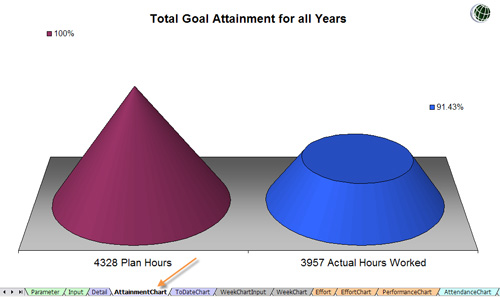
| Attainment Chart: One high school football coach used this program to chart wins based on 3rd down attainment, excuses on why it did not work and team member attendance. He found it very revealing and changed the approach team incentives. | ||||
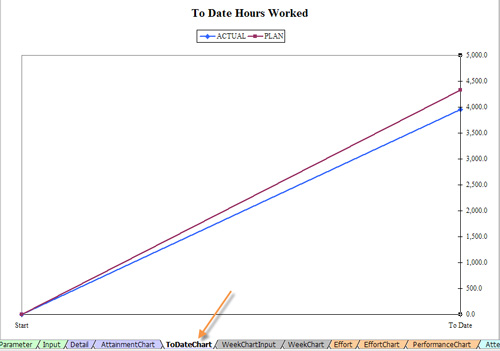
The planned hours are set at 4328 labor hours and actual hours are calculated at 3957 labor hours. The project is currently at 91.43% over 109 work weeks. We also see from the chart below that this year, we are running our actual labor hours slightly below the planned labor hours (6 work weeks).
There are 50 Technician Input Sheets to monitor Attendance for the project. Each "T" sheet allows user input as to the identity, employee number and any previous year attendance issues. The sheet breaks the desired user calendar down into days of the week and identifies Saturdays and Sundays. Observing how attendance issues occur coupled with actual work and overtime hours could provide yearly performance data points.
|
||||
Insight: The
Effort Comparison and "T" Charts will reflect each person's
status on goal attainment (100%). At this point it could be included
that when we used these charts we noted our top paid technicians
were consistently in the overtime pay category. We formulated the
following questions: |
||||
©Copyright
2025 BIDQWIK™.COM All Rights Reserved No use of information without express written permission| from Peter Buitenhek |
||||